Skip to content

Services · Connect & extend

BI dashboards and reports inside ERPNext

Dashboards and reports that answer the questions management asks every week, built on the live data already in ERPNext.

No exports to spreadsheets, and every number links back to the documents behind it.

  • Inside ERPNext
  • Arabic and English
  • IFRS statements
  • Scheduled email reports
Example: P&L dashboard from our dashboards app
Example: P&L dashboard from our dashboards app. Screens show demo data.

Who it is for

For managers who want answers, not exports

  • Owners and boards
  • CFOs and finance teams
  • Operations and branch managers
  • Sales leaders tracking targets
  • Groups that consolidate several companies

Ready to install

Start with our dashboards app

Financial dashboards and IFRS statements are available as an app in our App Store, and can be extended for your own reports.

Visit the App Store →

What is included

What we build

From one KPI card to a full management pack.

Management dashboards

One page per role with the numbers, trends and queues that person acts on.

  • Number cards and charts
  • Filters by company, branch and period

Financial statements

Balance sheet, income statement and cash flow in IFRS layouts, monthly or yearly.

  • Comparisons with prior periods
  • Export to Excel and PDF

Custom reports

Script and query reports for the questions standard reports do not answer.

  • Drill down to documents
  • Same permissions as ERPNext

Scheduled delivery

Reports emailed to the right people on a fixed schedule, as PDF or Excel.

  • Daily, weekly or monthly
  • Arabic or English

In practice

Dashboards we built

Dashboards we built

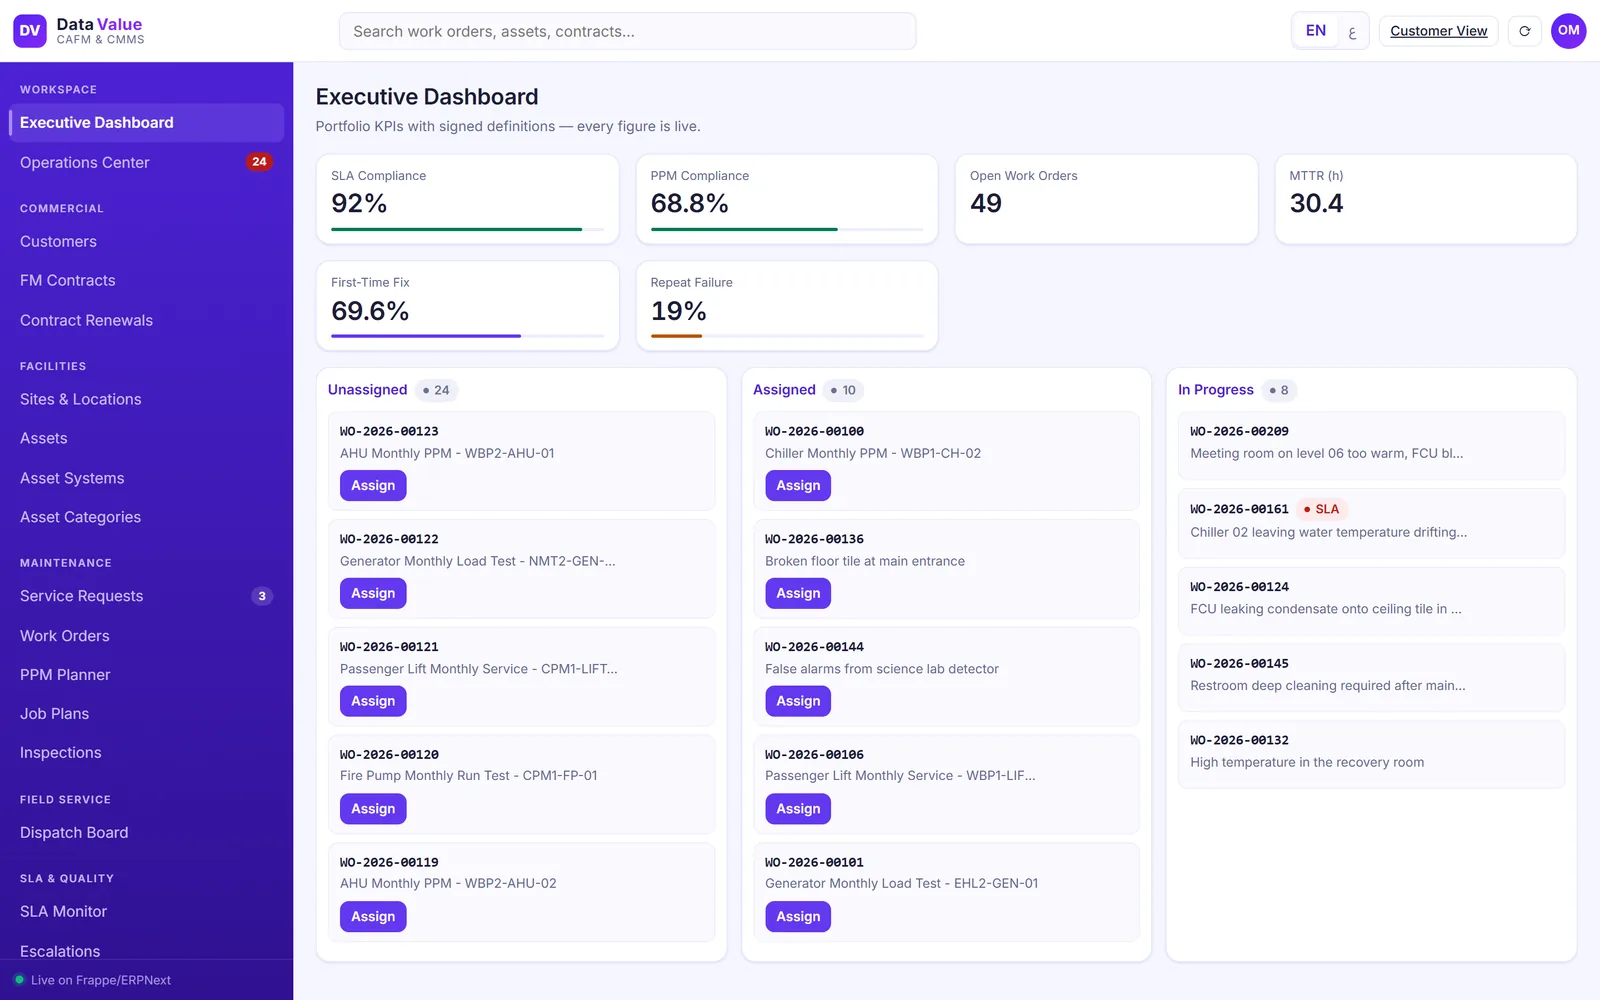
Operations dashboard

Work orders, response and completion in one view for the operations head.

  • Open work by status
  • Trends by month
  • Click through to each order
Example: executive dashboard in our CAFM solution

Dashboards we built

Portfolio and collections trends

Occupancy, collections and what is outstanding, by building and by month.

  • Collected against outstanding
  • Occupancy by building
  • Units by status
Example: trends dashboard in our property solution

Dashboards we built

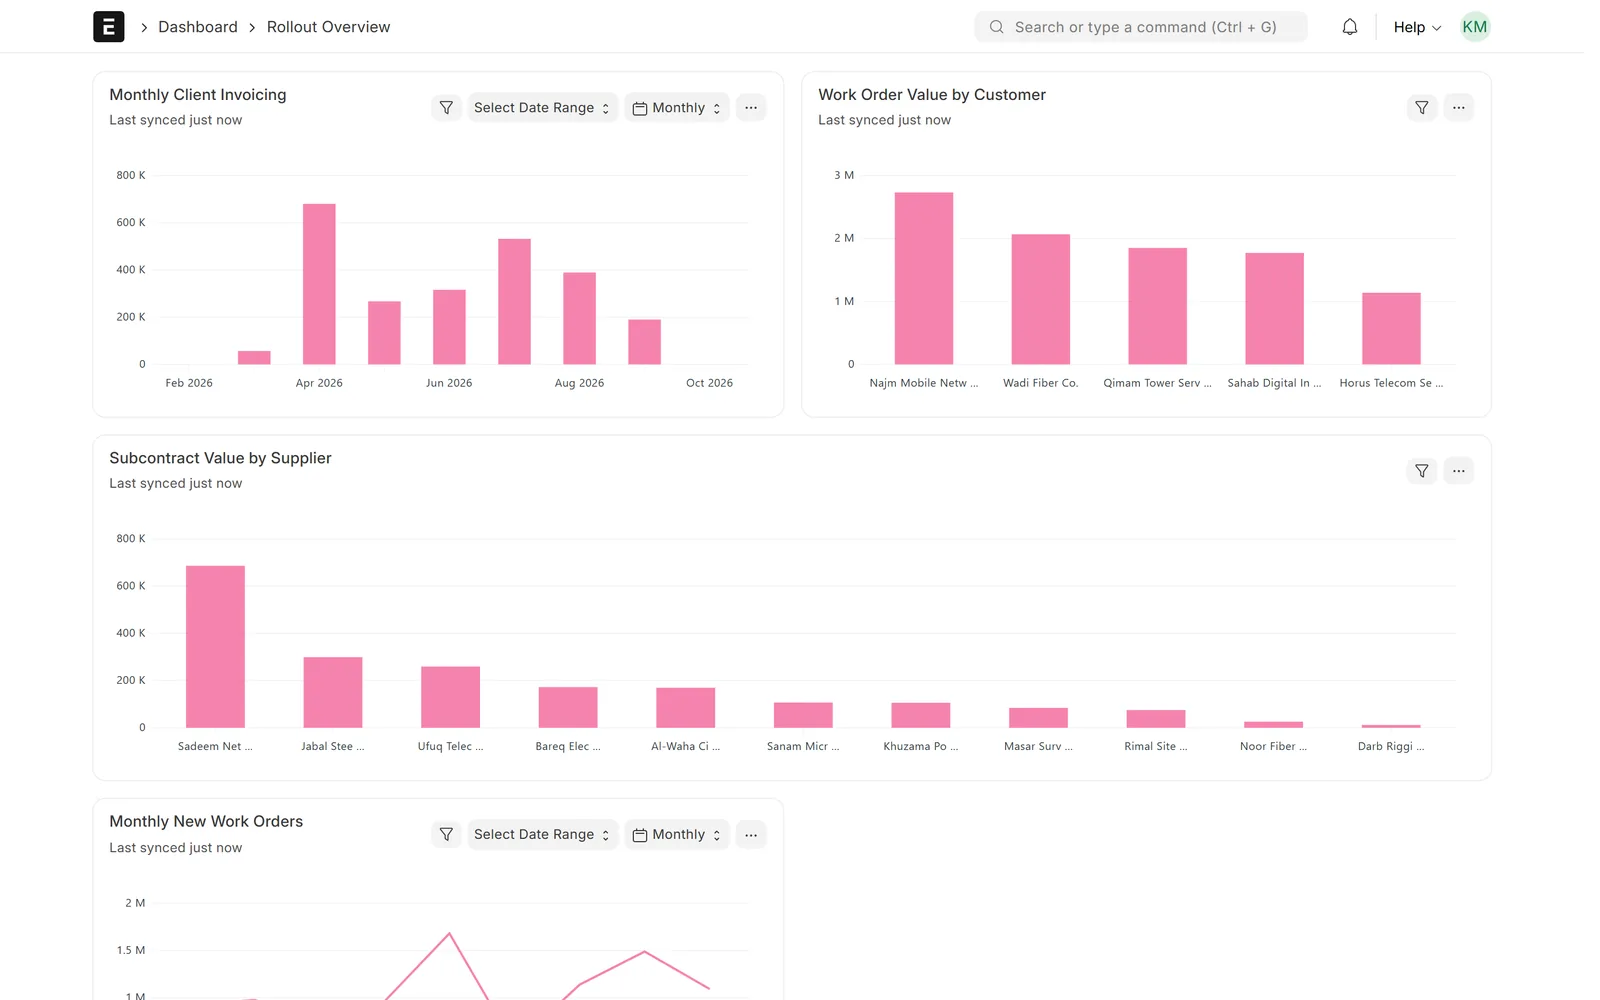
Rollout and invoicing dashboard

Monthly invoicing, work order value by customer and subcontract value by supplier.

  • Charts from live data
  • Filters by date range
  • Monthly or weekly views
Example: rollout dashboard in our telecom contracting solution

Screens show demo data.

Module features

What ERPNext reporting covers

12 capabilities in 4 groups.

Financial statements

Profit and loss by period

Income, expenses and net profit by month, quarter or year, with a chart and drill-down to the ledger.

  • Compare periods side by side
  • Filter by cost centre or project
  • Several companies consolidated
Profit and loss statement by quarter

Financial statements

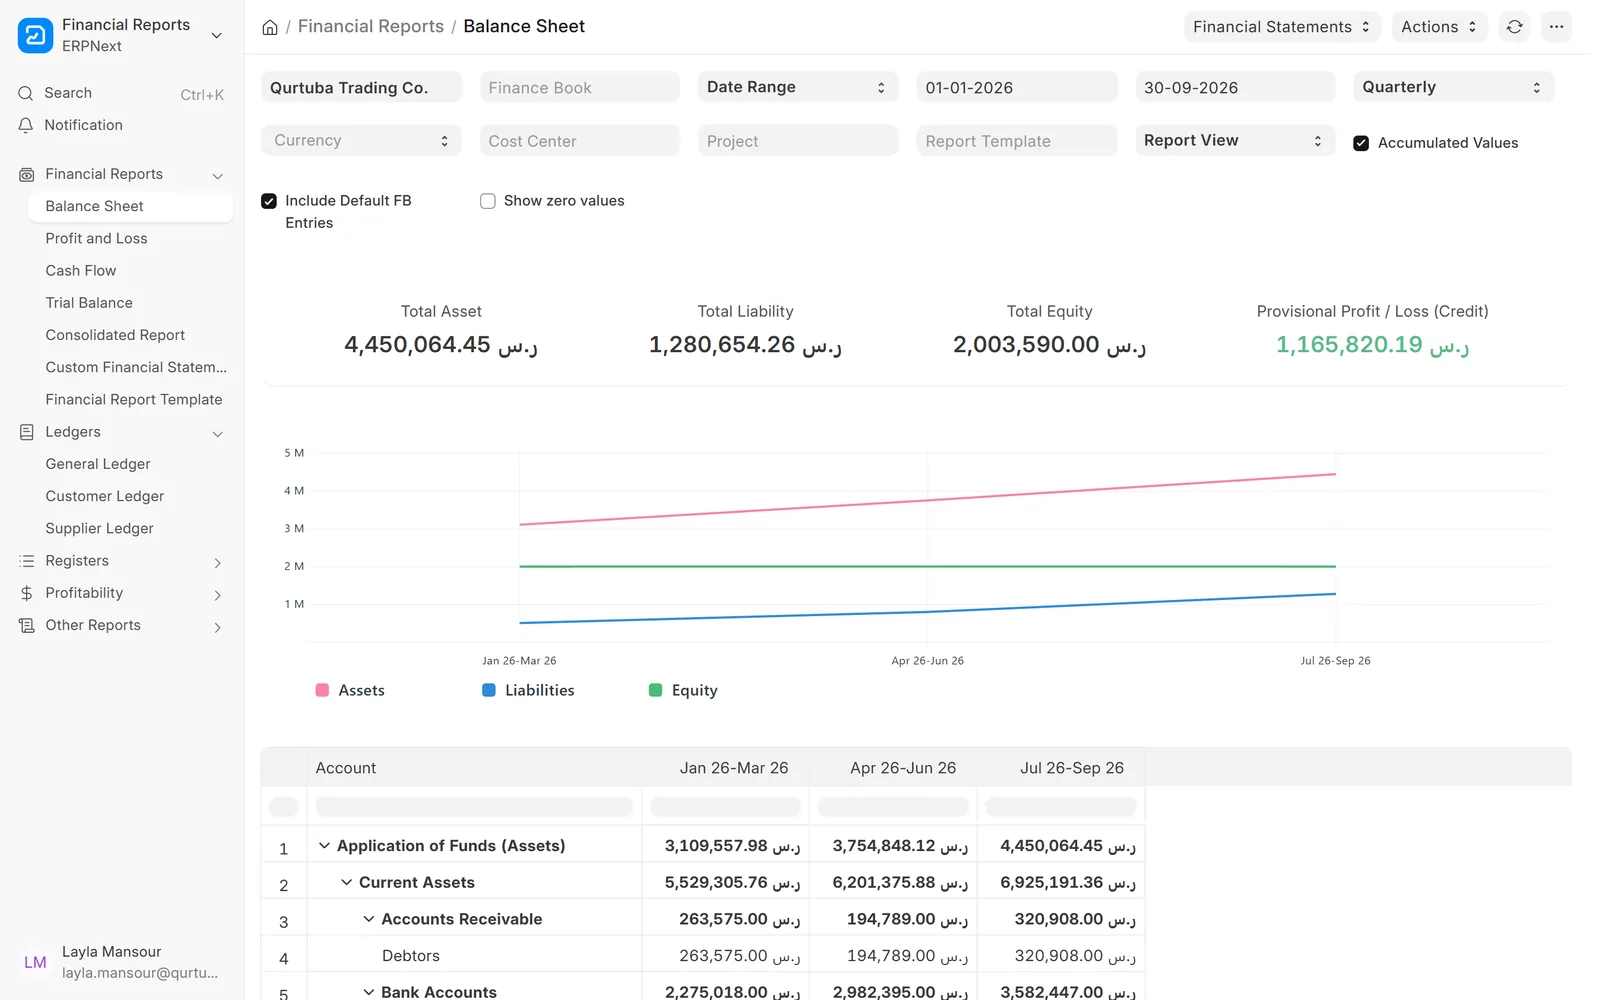
Assets, liabilities and equity

The balance sheet at any date, with totals and a trend chart.

  • Accumulated or per-period values
  • Provisional profit shown until closing
  • Export to Excel or PDF
Balance sheet by quarter

Financial statements

Where the cash came from and went

Operating, investing and financing cash flow, built from your ledger.

  • Indirect method from profit for the period
  • Changes in receivables, payables and stock
  • Quarterly or monthly columns
Cash flow statement by quarter

Analytics

Dashboards with number cards and charts

Ready dashboards for accounts, payments, sales, stock, assets, HR and payroll, which you can rearrange.

  • Number cards for key totals
  • Monthly bar and line charts
  • Receivable and payable ageing
Payments dashboard with bills, payments and ageing

Analytics

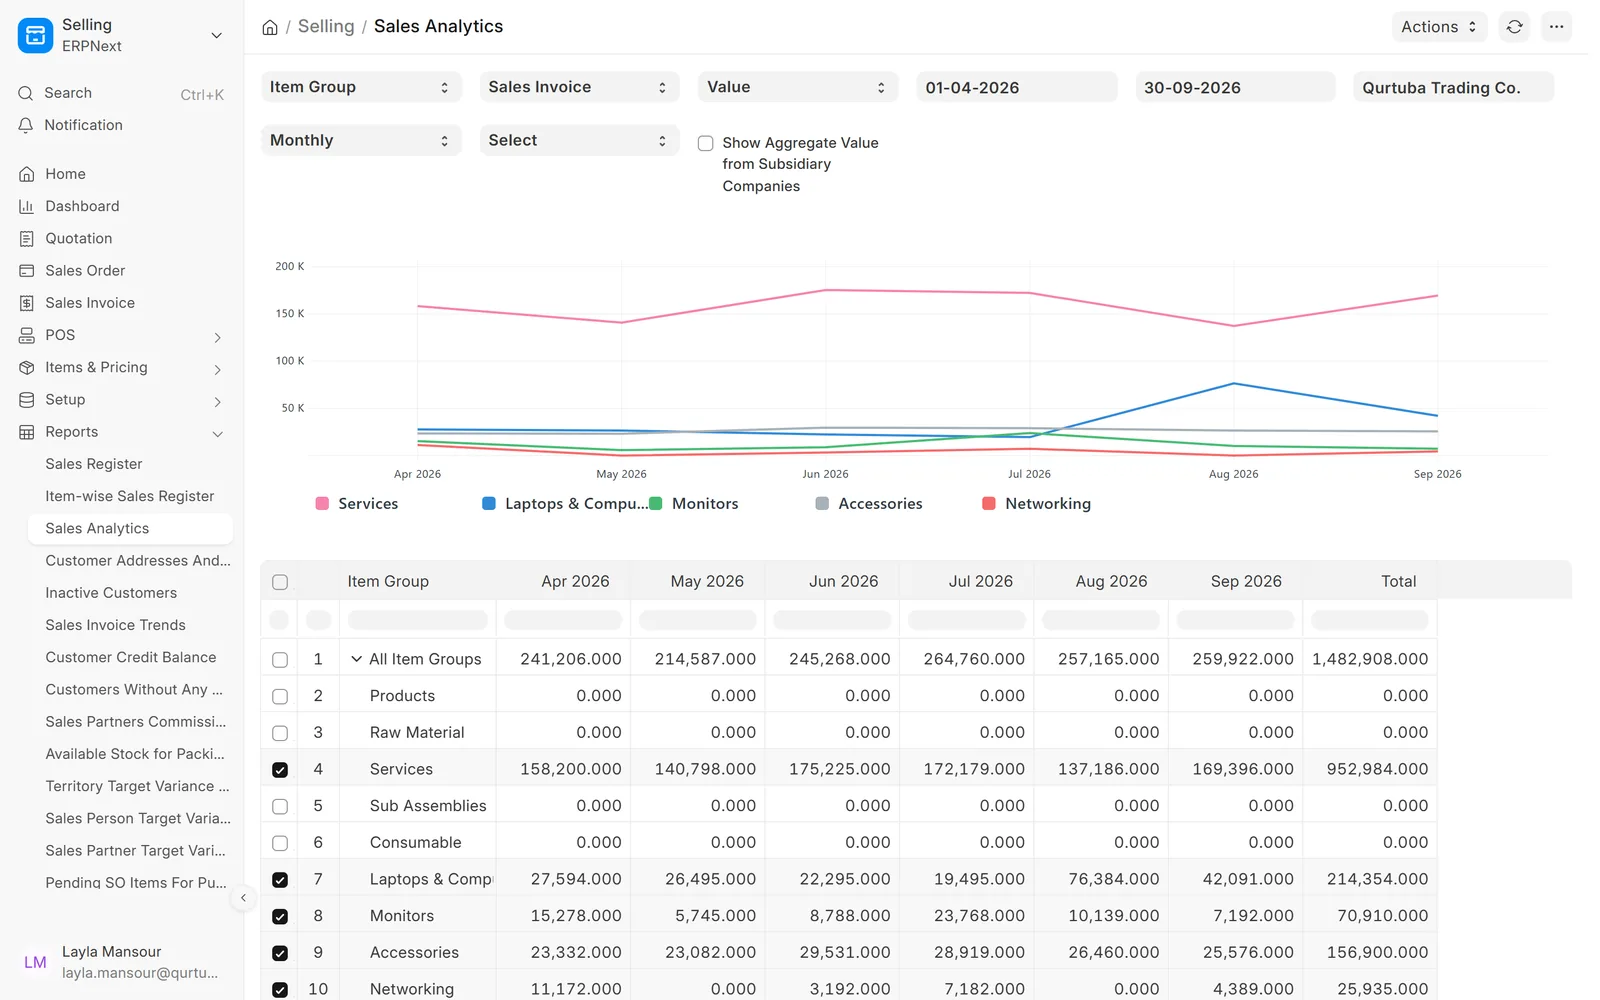
Sales by item group, customer or territory

A tree report by month with a chart of the rows you select.

  • Value or quantity
  • Monthly, quarterly or yearly
  • Sales orders, invoices or deliveries
Sales analytics by item group and month

Analytics

Who owes what, and for how long

Accounts receivable with ageing buckets, by customer or by invoice.

  • Ageing by due date or posting date
  • Summary and detail views
  • Filter by sales person or territory
Accounts receivable with ageing chart

Your own reports

Margin by item group

Selling amount, buying amount and gross profit by item, group, customer or invoice.

  • Grouped the way you choose
  • Uses actual stock valuation
  • Totals and percentages
Gross profit by item group

Your own reports

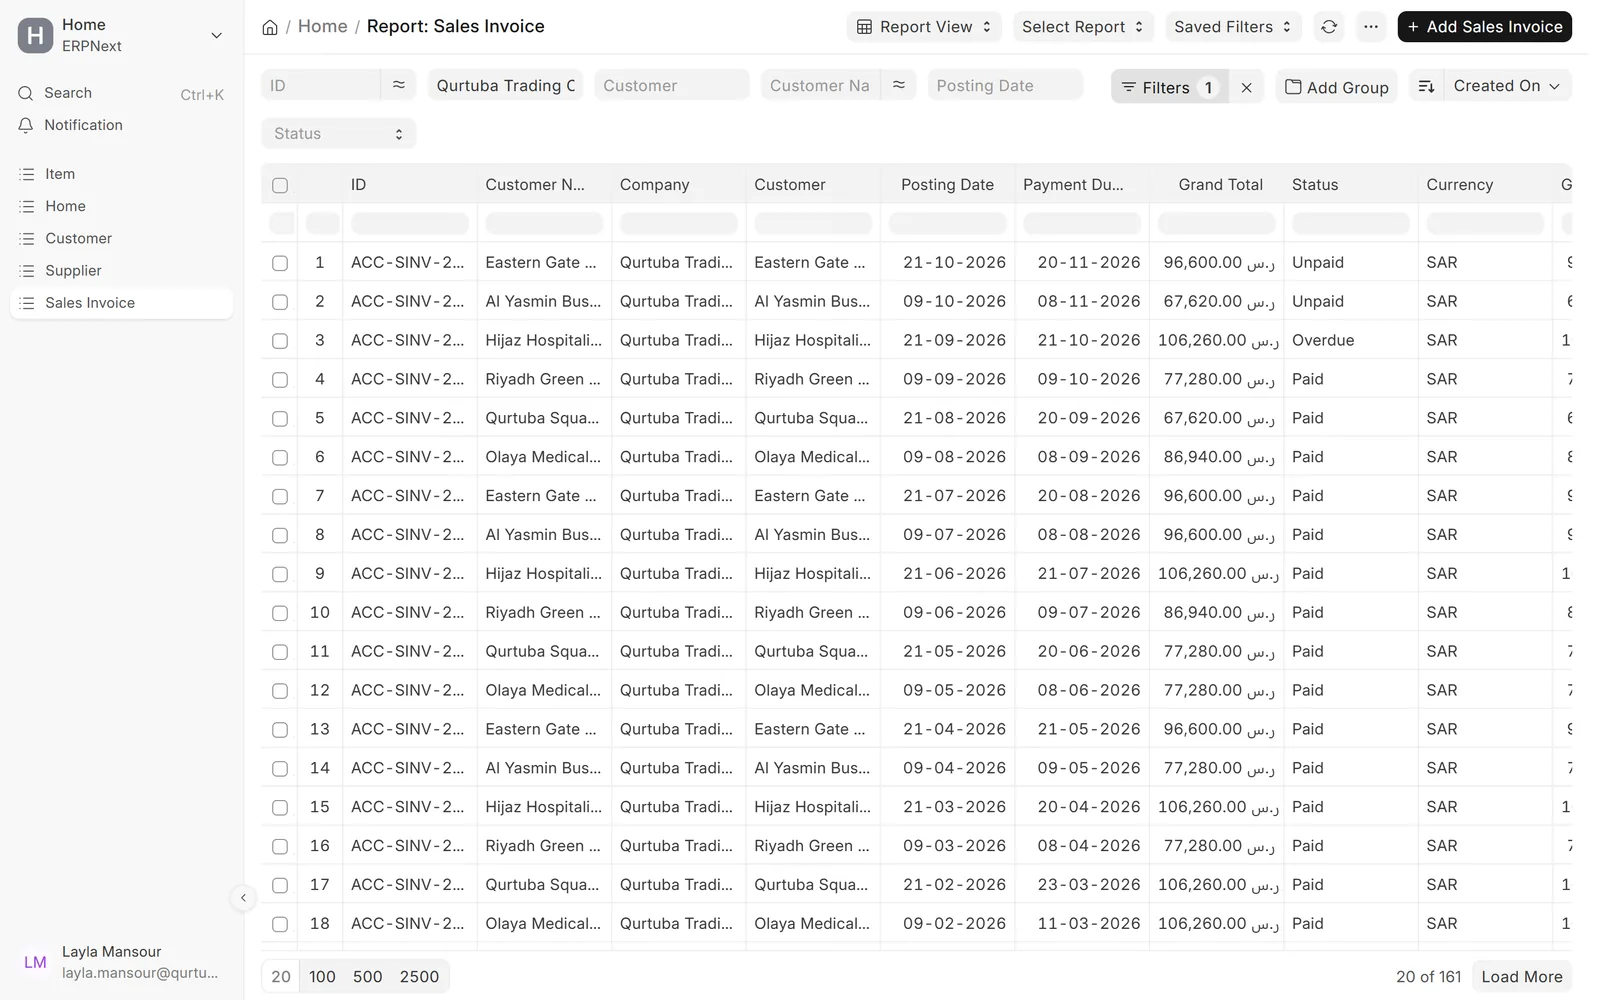
Build a report without code

Pick columns, filters, grouping and sorting on any document list and save it as a report.

  • Any document type
  • Group by with totals
  • Saved and shared reports
Report builder on sales invoices

Your own reports

Management dashboards from our app

Revenue, gross profit, cash, receivables and payables on one home page, with drill-down dashboards behind it.

  • Arabic and English
  • Live from ERPNext transactions
  • Runs on ERPNext 15
Data Value Dashboards home page

Data Value Dashboards app

Financial statements in IFRS layout

Balance sheet, profit and loss and cash flow in an IFRS-style layout, with quick date ranges and a trend chart.

  • Quick ranges such as this quarter or YTD
  • Monthly columns
  • Export to Excel
IFRS-style balance sheet in the dashboards app

Data Value Dashboards app

Margins at a glance

Revenue, cost of goods sold, gross and net margin with gauges and a waterfall chart.

  • P&L breakdown by account
  • Revenue and net profit by month
  • Filter by company and dates
P&L dashboard with margins and charts

Data Value Dashboards app

A financial audit page

Key balances and counts with alerts, to spot issues before month-end closing.

  • Revenue, margins, cash and working capital
  • Alerts for issues found
  • Export to PDF or Excel
Financial audit dashboard

Screens show demo data.

Challenges vs. solutions

Common reporting problems, and how we avoid them

ChallengeHow Data Value does itCommon approach
Monthly reports built by hand in ExcelLive dashboards and scheduled reports from ERPNextExporting, pasting and formatting every month
Numbers nobody can traceEvery figure opens the documents behind itTotals copied from other files
A separate BI tool with its own copy of dataDashboards inside ERPNext with the same permissionsNightly copies and another login
Statements that do not follow IFRS layoutsIFRS balance sheet, income statement and cash flowRe-arranging the standard report by hand

Why Data Value

Why teams choose us for this work

Our own dashboards app

Financial dashboards and IFRS statements we built and maintain.

Arabic done properly

Screens, prints and documents right to left, not translated as an afterthought.

Questions first

We start from the decisions you make, not from the charts a tool can draw.

We build our own products

Ready-made solutions, App Store apps and connectors come from the same team.

Frappe Certified Gold Partner

Recognised by Frappe, the company behind ERPNext.

One team after go-live

The people who did the work stay on to support it.

How it works

How a reporting project runs

  1. QuestionsWe list the questions each manager asks and how often.
  2. Data checkWe check the data in ERPNext can answer them, and fix gaps.
  3. SketchLayouts agreed on paper or on a demo site.
  4. Build and verifyNumbers checked against standard reports.
  5. Hand overUsers trained; schedules and permissions set.

FAQ

Frequently asked questions

Do we need a separate BI tool?

Usually not. Most management dashboards and reports can live inside ERPNext, with the same users and permissions. We tell you when an outside tool makes sense.

Can we get IFRS financial statements?

Yes. Our dashboards app includes IFRS balance sheet, income statement and cash flow layouts, and it can be extended.

Will the dashboards work in Arabic?

Yes. Labels, numbers and layouts work in Arabic and English, right to left.

Can reports be emailed automatically?

Yes. Reports can be sent on a schedule to chosen people as PDF or Excel.

How is reporting work priced?

It depends on the number of dashboards and reports and on how ready the data is. We send a written proposal after reviewing your list of questions.

Are reports live or updated overnight?

Standard reports read live data when you open them. Some dashboard charts are cached and refresh on a schedule or when you refresh the chart.

Which ERPNext versions does the Data Value Dashboards app support?

It is built for ERPNext 15. If you run another version, ask us and we will tell you where it stands before you plan around it.

Can we get reports by email?

Yes. ERPNext can email a saved report on a schedule, as Excel, CSV or HTML, to the users you choose.

Can you build a report that does not exist?

Yes. Many lists can be made with the report builder. For more complex reports and dashboards we build them in a separate app so upgrades stay safe.

Send us the questions you ask every week

Book a call and bring the reports you build by hand today. We will show you what they look like inside ERPNext.

Free demo · No commitment